systemd service monitoring
Every server with systemd gets a Services panel on its page — nothing to install or configure beyond the collector itself. The collector takes a snapshot of the server’s systemd services every 5 minutes over D-Bus, so the panel answers “what’s running, what’s failed, and what’s eating memory” without an SSH session.
The table
Section titled “The table”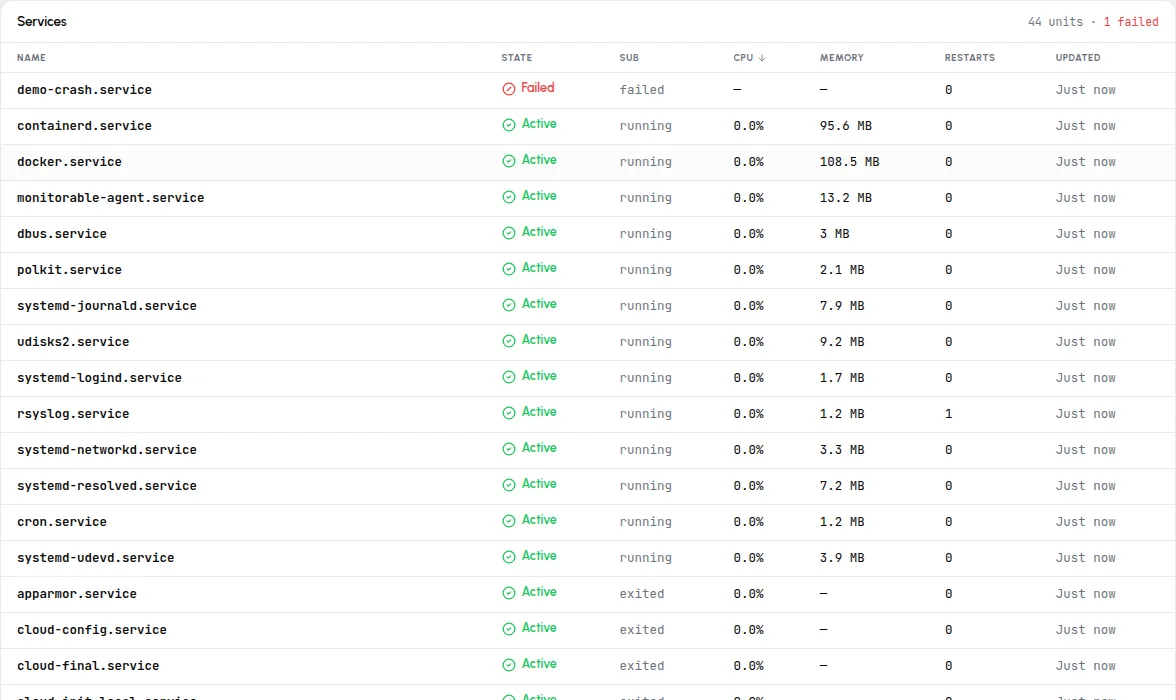
The header counts what the last snapshot saw — “43 units · 43 active” on a healthy server, “44 units · 1 failed” when something is wrong. Failed units always sort to the top, whatever column you sort by; the red Failed badge is the panel’s whole reason to exist.
| Column | Meaning |
|---|---|
| Name | The unit name, like nginx.service. |
| State | systemd’s load state: Active (green) or Failed (red). |
| Sub | The sub-state — running, exited for oneshots that completed, failed. |
| CPU | The unit’s CPU usage since the previous snapshot, on the whole-server 0–100% scale (not per-core). The first snapshot after a collector start shows — — there’s no previous sample to measure against yet. |
| Memory | The unit’s current memory, from its cgroup. |
| Restarts | How many times systemd has restarted the unit. |
| Updated | Age of the snapshot the row came from. |
Click Name, State, CPU, Memory, or Restarts to re-sort; the default is CPU, highest first.
Which units appear
Section titled “Which units appear”The snapshot covers .service units that are active, changing state, or
failed. A service that is stopped and supposed to be stopped isn’t
listed — the panel shows what’s running and what’s broken, not your unit
catalog. Per-unit fields and what is never read (unit files, command
lines, environments) are listed in
What the collector collects.
The detail sheet
Section titled “The detail sheet”Click any row for the unit’s full snapshot:
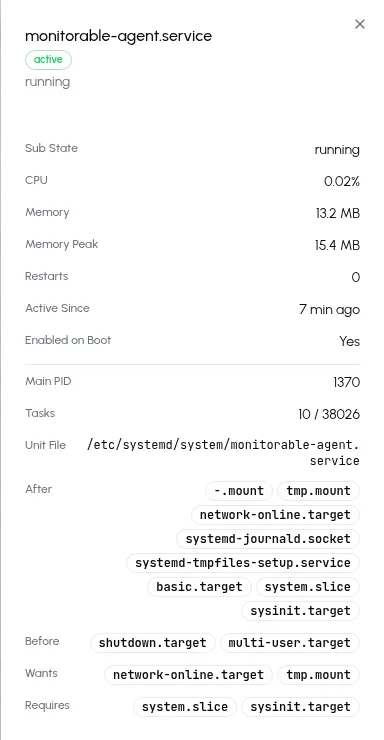
Beyond the table’s numbers, the sheet adds Memory Peak, Active Since, Enabled on Boot, Main PID, Tasks (current against the unit’s limit), the Unit File path, and the unit’s dependency lists (After, Before, Wants, Requires). A failed unit has no main process anymore, so its sheet shows the failure state without a Main PID.
A failed unit can page you
Section titled “A failed unit can page you”If the server’s alert template has the Systemd unit failed rule
enabled, a unit entering the failed state fires an incident named after
it — the failure above produced “Systemd unit demo-crash.service is in a
failed state” within one snapshot cycle. A service that keeps
crash-looping trips the separate Systemd restart loop rule via the
restart counter instead. Defaults for both are in
How alerting works; the incident resolves on
its own once the unit is back to active or has been cleaned up with
systemctl reset-failed.