Install the collector
Each server you monitor runs one collector, installed by a script with a per-server API key. The install takes about a minute; the first metrics arrive about a minute after that.
You need:
- A Linux server on x86_64 (amd64) or arm64, with systemd and
curl. Bare metal, VMs, and LXC containers all work. The collector is Linux-only. - Root access on that server. Installing needs it; the collector itself then runs as an unprivileged user — see Requirements & permissions.
- Outbound HTTPS from that server. The collector pushes metrics out and opens no listening ports.
Get this server’s install command
Section titled “Get this server’s install command”- In the dashboard, open Servers and click Add server.
- Enter a name and click Add Server. The name is only the label the dashboard shows — it doesn’t need to match the server’s hostname.
- Copy the command from the Install the collector dialog. It embeds the API key this collector authenticates with, and it is shown only once.
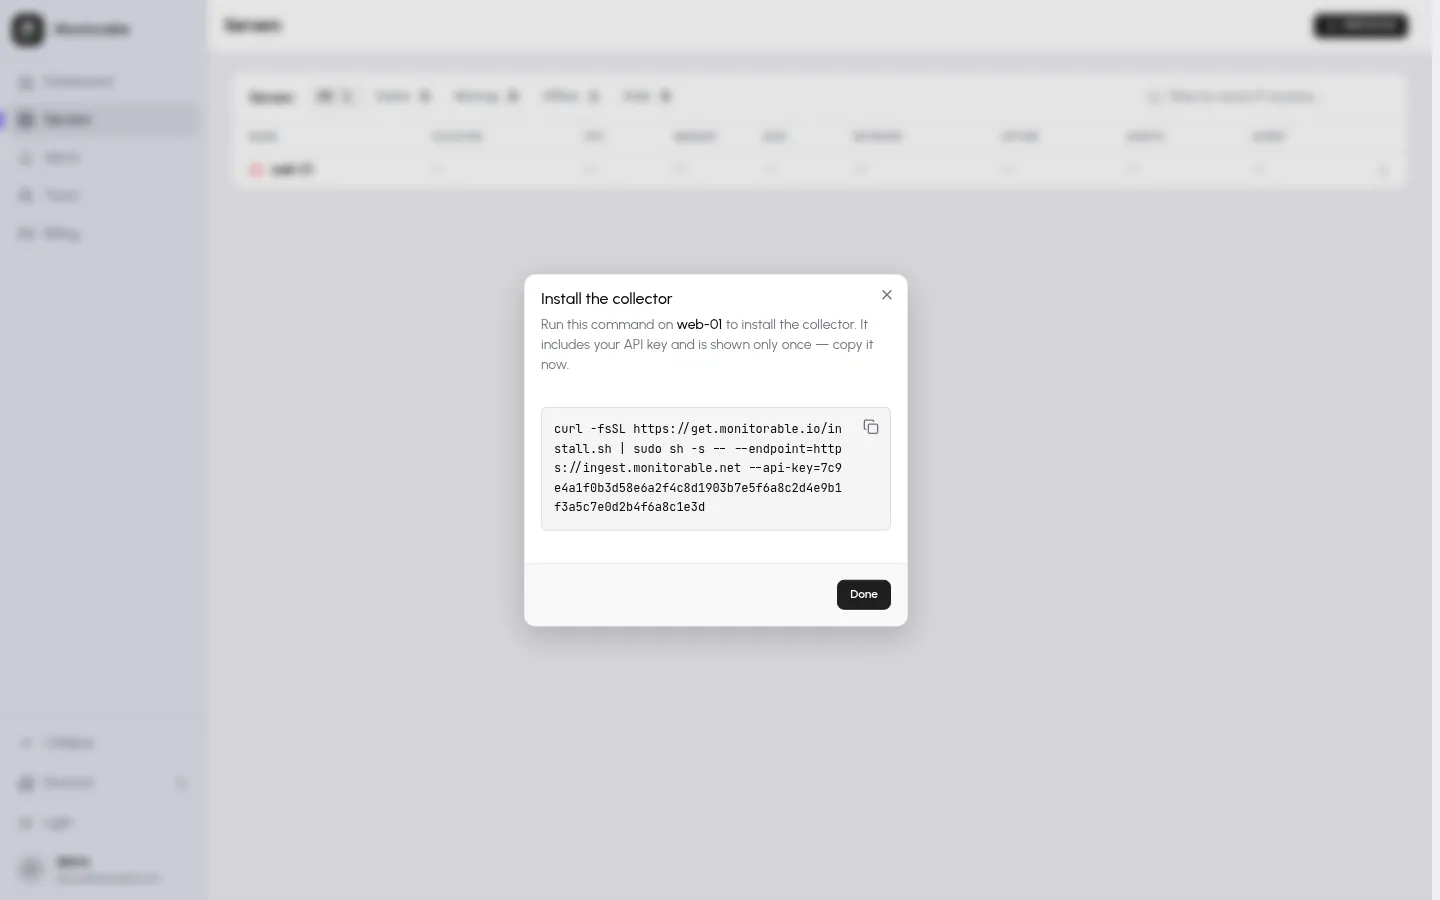
If you closed the dialog without copying, remove the server (Server actions → Remove on its row of the Servers page, then confirm) and add it again — you get a fresh command with a new key.
Run the command as root
Section titled “Run the command as root”Paste the command into a root shell on the server. It has this shape:
curl --proto '=https' --tlsv1.2 -fsSL https://get.monitorable.net/install.sh | sudo sh -s -- --endpoint=https://ingest.monitorable.net --api-key=<your-api-key>The script is readable in your browser if you want to inspect it before piping it into a root shell. Step by step, it:
- Detects the OS and CPU architecture. Anything other than Linux on amd64 or arm64 exits with an error before touching the system.
- Creates the
monitorablesystem user and group, with no login shell. If adockergroup exists, the user joins it so container metrics work. - Creates
/opt/monitorable(the agent binary — no separate launcher),/etc/monitorable(configuration and the env file),/var/lib/monitorable, and/var/log/monitorable. - Downloads the agent binary for the detected platform and the base
configuration, checks the release’s signed checksum file with
opensslagainst the key built into the script, and verifies every download against it. If anything doesn’t match, it stops before installing. - Probes the server’s drives and grants SMART disk-health capabilities only if a physical NVMe or SATA drive is present — nothing on a typical VPS. How that works.
- Writes the
monitorable-agent.servicesystemd unit and a root-only/etc/monitorable/agent.envfile holding your API key and endpoint, enables the service, starts it, and confirms it stays up.
A successful install prints each step and ends like this:
🔧 Setting up systemd service...▶️  Starting service...✅ Service started successfully!
🎉 Installation complete!
After that the script prints the service status and the commands for viewing
logs (journalctl -u monitorable-agent -f) and restarting the service
(systemctl restart monitorable-agent).
Confirm the collector is reporting
Section titled “Confirm the collector is reporting”The collector sends its first batch about 60 seconds after the service starts: the server’s page in the dashboard switches to Online and the CPU, memory, and load panels draw their first points. On the server itself:
systemctl status monitorable-agent● monitorable-agent.service - Monitorable agent Loaded: loaded (/etc/systemd/system/monitorable-agent.service; enabled; preset: enabled) Active: active (running) since Fri 2026-07-10 21:52:18 UTC; 1h 19min ago Main PID: 1043 (monitorable-age) Memory: 12.0M (peak: 15.6M)Panels beyond CPU and memory appear as their data arrives: Docker containers on the next collection cycle, systemd services within about 5 minutes, SMART disk health within about 15 minutes (bare-metal servers only).
Re-run the same command to upgrade
Section titled “Re-run the same command to upgrade”The install script is also the upgrade path — there is no auto-update. Re-running the command downloads the current collector binary, swaps it in place without stopping the running service first, refreshes the configuration and service files, and restarts the service. History and charts continue uninterrupted: the API key is what ties the collector to its server in the dashboard.
A re-run also re-probes the server, so it picks up hardware changes: if you added a physical drive or installed Docker after the first install, re-running grants the collector what those features need.
You don’t need the original command: on the server, run
curl --proto '=https' --tlsv1.2 -fsSL https://get.monitorable.net/install.sh | sudo sh— the script reuses the API key and endpoint saved in
/etc/monitorable/agent.env.
If the service doesn’t start
Section titled “If the service doesn’t start”The script verifies that the service stays up. If the collector exits during its first seconds, the script prints the last 20 log lines and fails instead of reporting success. To keep watching after that:
journalctl -u monitorable-agent -fIf the service runs but the dashboard stays empty, work through No data appearing.