Quick start
Go from an empty account to live server metrics in about five minutes: add a server in the dashboard, run one command on it, and the first metrics arrive about a minute later.
You need:
- A Linux server (x86_64 or arm64) you can access as root. The collector is Linux-only.
- Outbound HTTPS from that server. The collector pushes metrics out; no inbound ports are opened.
Sign in
Section titled “Sign in”Open app.monitorable.io and continue with Google, GitHub, or your email address. There is no password: with email, Monitorable sends you a message containing a sign-in link and a 6-digit code — click the link, or enter the code and click Verify Code. The link and code expire after 15 minutes.
Signing in for the first time creates your account.
Add your first server
Section titled “Add your first server”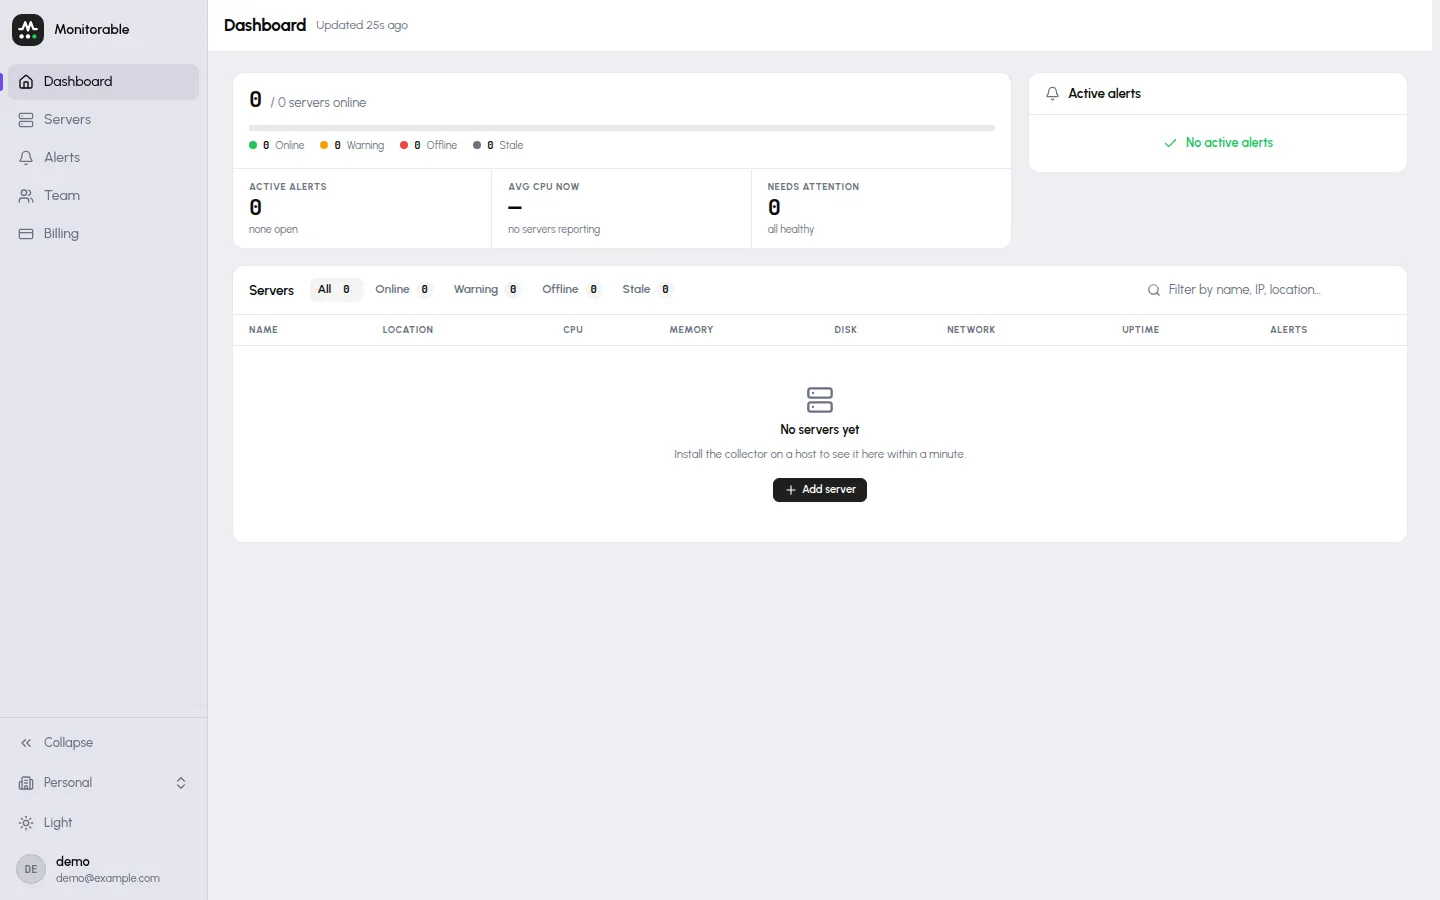
- Open the Servers page and click Add server. (The empty dashboard offers the same Add server button.)
- Enter a name — this is only the label the dashboard shows, so it doesn’t need to match the server’s hostname — and click Add Server.
- The Install the collector dialog appears with a one-line install command. It embeds this server’s API key and is shown only once, so copy it before closing the dialog.
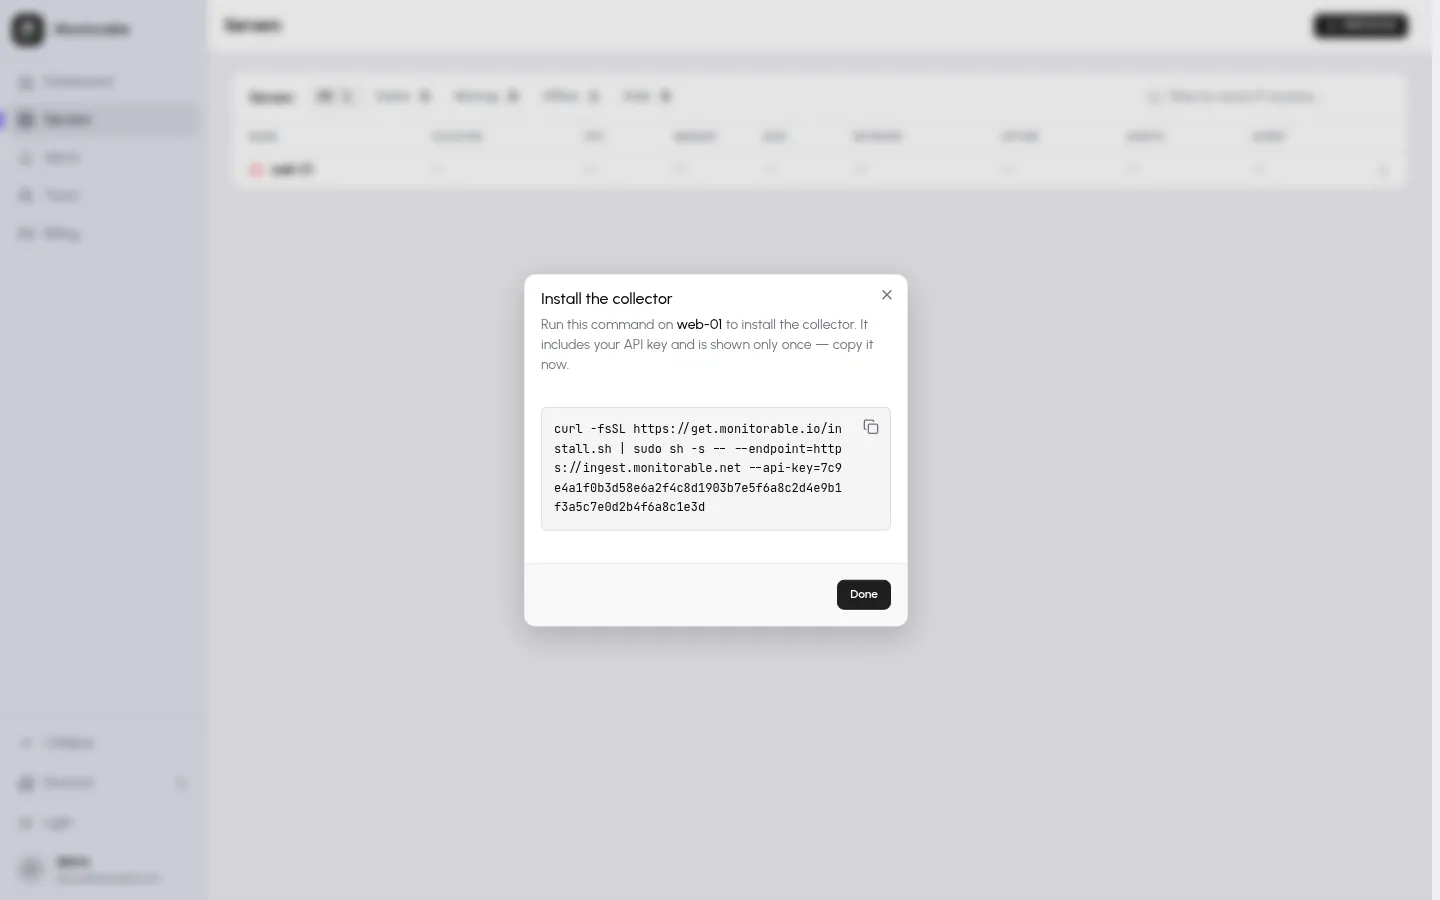
If you close the dialog without copying, remove the server (Remove in the row’s Server actions menu on the Servers page) and add it again to get a fresh command.
Run the install command
Section titled “Run the install command”Paste the copied command into a root shell on the server you want to monitor. It has this shape:
curl --proto '=https' --tlsv1.2 -fsSL https://get.monitorable.net/install.sh | sudo sh -s -- --endpoint=https://ingest.monitorable.net --api-key=<your-api-key>The install script creates an unprivileged monitorable system user, downloads
the agent binary and its configuration (verifying the signed release checksums), writes a
root-only env file with your API key and endpoint, and starts the agent as the
systemd service monitorable-agent.service:
🚀 Monitorable agent installer================================Endpoint: https://ingest.monitorable.netVersion: latest
Detected platform: linux/amd64Collector URL: https://get.monitorable.io/binaries/otel/latest/monitorable-agent-linux-amd64
👤 Creating user and group...Creating group: monitorableCreating user: monitorable📁 Creating directories...🔒 Setting up permissions...📦 Downloading the Monitorable agent...✅ Binary, config and unit template verified against SHA256SUMS💽 No physical disk detected — SMART disabled (no extra privileges)✅ Monitorable agent installed✅ Configuration file installed🔑 Writing agent.env...🔧 Setting up systemd service...▶️  Starting service...✅ Service started successfully!
🎉 Installation complete!
After the summary, the script prints the service status and the commands for
viewing logs (journalctl -u monitorable-agent -f) and restarting the
service (systemctl restart monitorable-agent).
Watch the first metrics arrive
Section titled “Watch the first metrics arrive”Back in the dashboard, open your server’s page. About 60 seconds after the install script finishes, the server’s status flips to Online and the CPU, memory, and load panels draw their first points. Charts fill out as data accumulates — give it a few minutes.
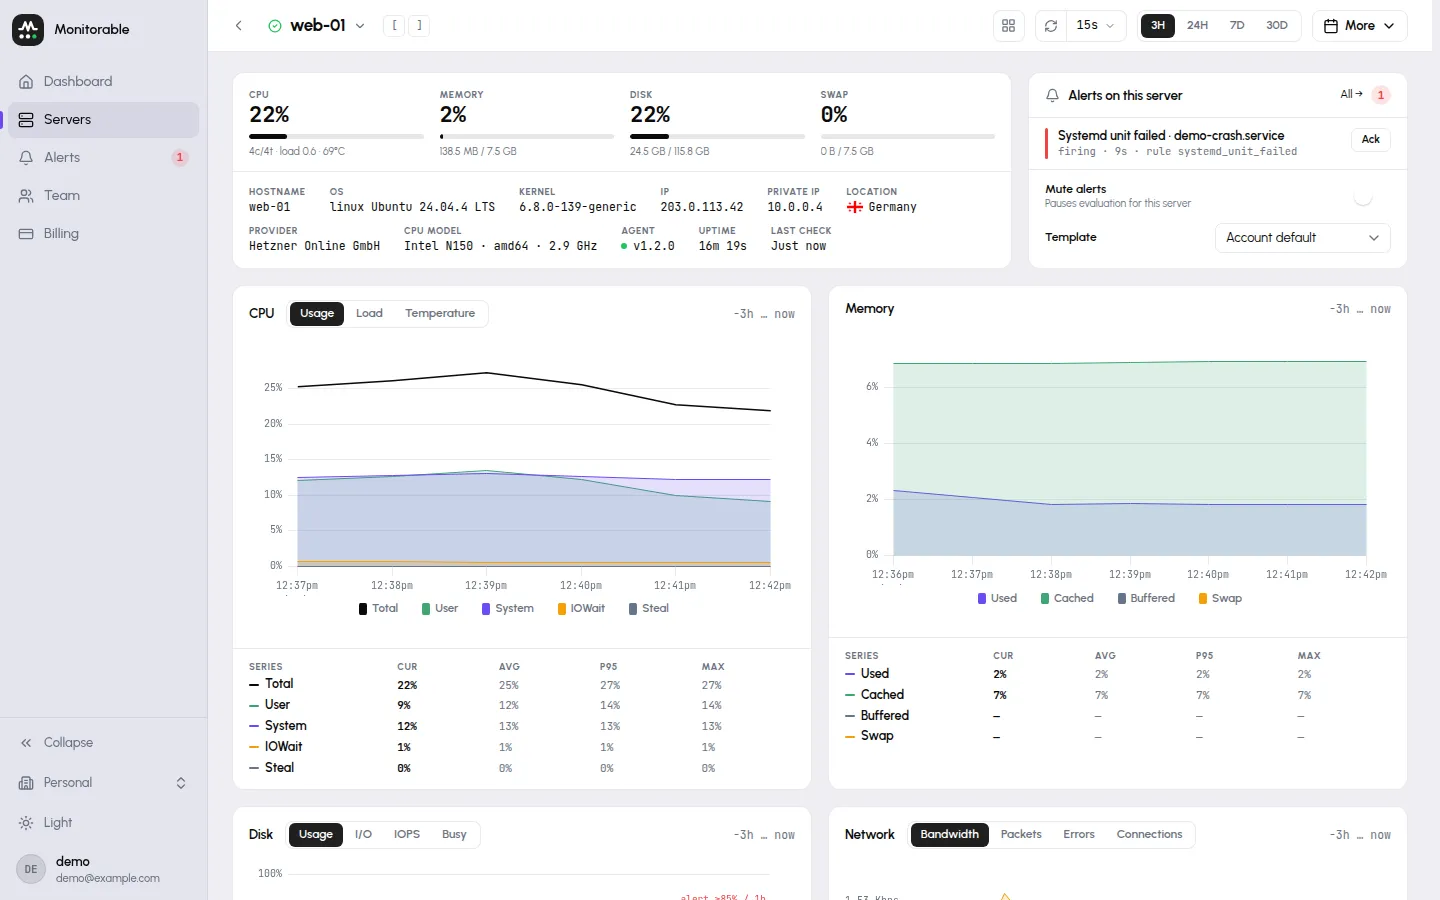
Two panels depend on what the collector finds: Docker containers appear only when Docker is installed, and SMART disk health only on bare-metal servers — virtual machines don’t expose physical drives.
Alerts are already on
Section titled “Alerts are already on”Adding your first server also sets up alerting: your account gets a Default alert template (12 of 19 rule types enabled) and an Account email notification channel that points at your sign-in address. When a rule fires, the incident appears under Alerts and you get an email — there is nothing to configure for that. How alerting works covers templates, reminders, and acknowledgment.
To route alerts elsewhere (Telegram, Discord, Slack, PagerDuty, webhook, or ntfy), go to Alerts → Channels and click Add channel — see Notification channels.
If no metrics appear
Section titled “If no metrics appear”Check the service on the server:
systemctl status monitorable-agentIf it shows active (running), watch the logs for delivery errors and confirm
the server can reach https://ingest.monitorable.net over HTTPS:
journalctl -u monitorable-agent -fNo data appearing walks the full checklist, including what the delivery-error log lines mean.