Host metrics panels
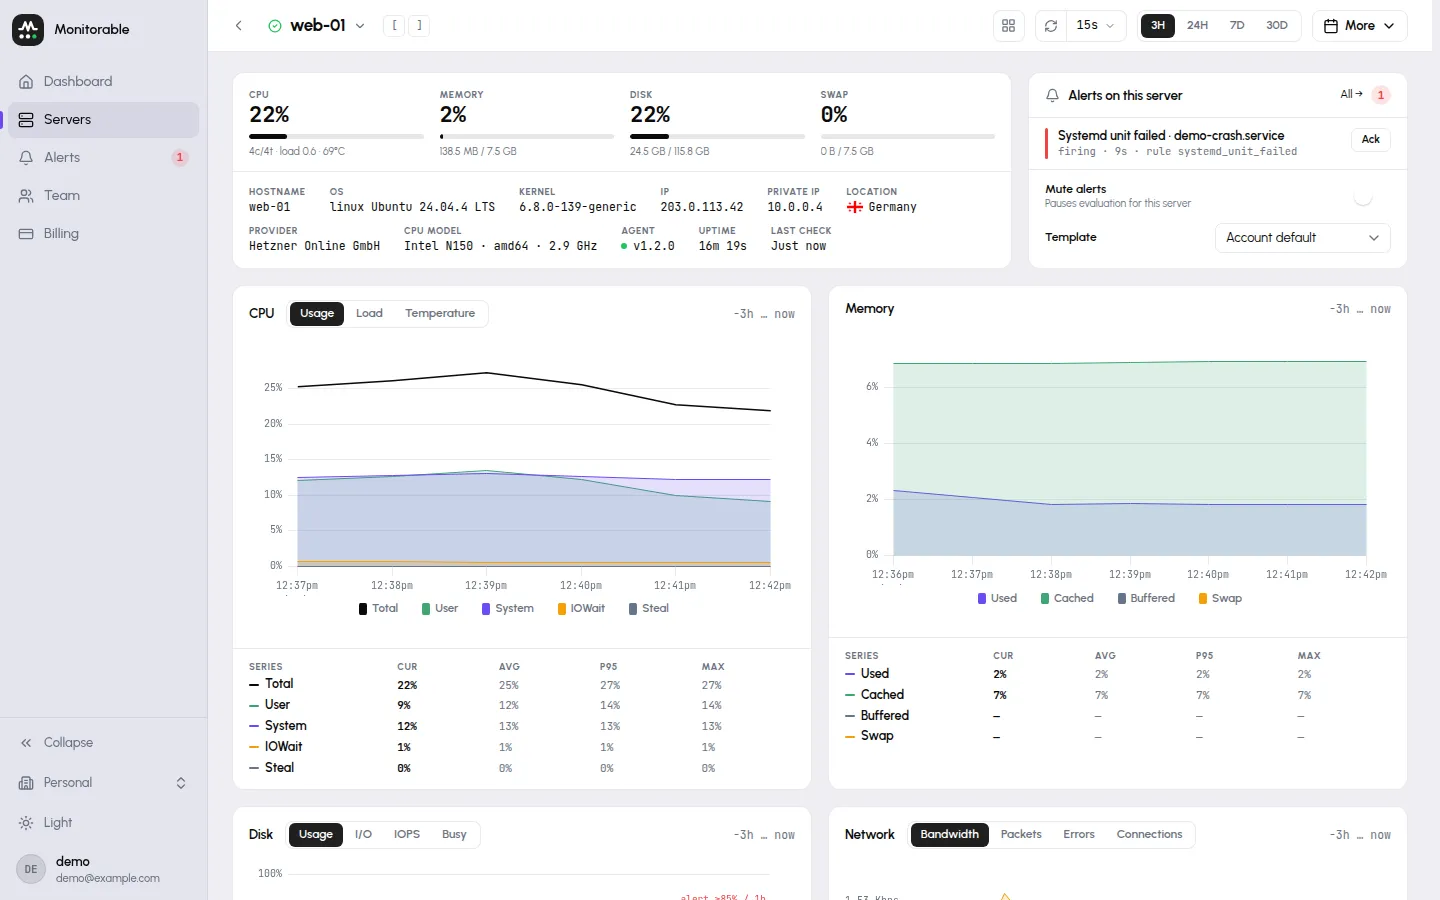
Open any server from the Servers page to get its metrics view: a status bar with live gauges on top, then a grid of chart panels. Data arrives from the collector once a minute, so every chart has per-minute detail for recent ranges.
The status bar and summary
Section titled “The status bar and summary”The top of the page answers “is this server OK right now”:
- Status — the icon next to the server name in the page header: Online; Warning when load, memory, or disk usage is very high; Stale after 5 minutes without data; Offline after 15.
- Four gauges: CPU (with core count, load average, and temperature underneath), Memory, Disk (the root filesystem), and Swap.
- Server details: hostname, OS, kernel, IPv4 and IPv6 (each shown when the server has it), location, provider, CPU model (with architecture and clock), Agent version (a green dot means it is the current release), Uptime (hovering shows the exact boot time; a Reboot required icon appears next to it when the server has a pending reboot — the flag Ubuntu and Debian set after kernel or libc updates), and Last check — when the most recent batch arrived. Location and provider are derived from the public IP — the collector doesn’t collect them (what it does send).
The server list shows the IPv4 address when a server has both; location comes from the same address.
Reading a chart panel
Section titled “Reading a chart panel”All chart panels share the same controls:
- Time range — the 1H, 3H, 24H, 7D, and 30D buttons in the page header apply to every panel at once; More, at the end of the same bar, holds the remaining presets (6H, 12H, 3D, 15D, 3M, 6M, 1Y) and a custom range. Ranges up to 24 hours draw per-minute points, ranges up to 30 days hourly averages, and longer ones two-hour averages, so long-range charts look smoother than short-range ones. A range longer than your plan’s data retention starts at the oldest data kept.
- Cur / Avg / P95 / Max — a stats table under each chart, one row per series, computed from exactly the points the chart is showing. Change the range and the stats follow.
- Refresh — the page header has a refresh-now button and an auto-refresh interval (Off to 3h, default 15s).
- Layout — the Single column toggle switches the panel grid to one full-width panel per row.
Three tabs:
- Usage — Total, User, System, IOWait, and Steal, as percentages of the server’s whole CPU capacity: 100% means every core is busy. (Container CPU works differently — see Docker container monitoring.)
- Load — 1m Load, 5m Load, 15m Load load averages.
- Temperature — one line per temperature sensor the collector can read; virtual machines usually expose none.
Memory
Section titled “Memory”One chart with Used, Cached, Buffered, and Swap lines. Cached and buffered memory is reclaimable, so a high cached value is normal on a busy server — watch Used and Swap for pressure.
Four tabs:
- Usage — how full the filesystem is over time.
- I/O — read and write throughput.
- IOPS — read and write operations per second.
- Busy — the share of time the device spent servicing requests.
I/O, IOPS, and Busy break down by physical device (nvme0n1, sda, …)
with the Per-device toggle, and the stats grid splits into Read
and Write columns — including a Total row for data moved over the
visible range.
Network
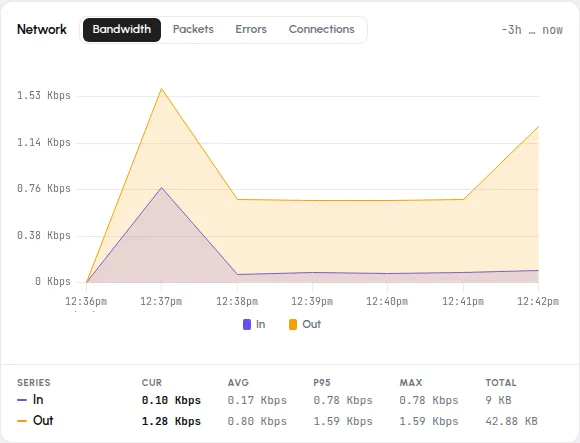
Section titled “Network”Four tabs — Bandwidth (In/Out), Packets, Errors, and Connections (TCP connections by state, such as Established and LISTEN). Bandwidth’s stats table has an In and an Out row and adds a Total column: data transferred over the visible range.
When a panel is missing
Section titled “When a panel is missing”Panels reflect what the collector finds on the server: without reachable Docker the Containers panel stays at “No containers detected on this server” (details), and Disk Health renders only for physical drives on bare-metal servers. A panel is missing or empty walks the checks panel by panel. If every panel is empty and the server shows Offline, that’s a delivery problem, not a display one — start with No data appearing.